d3.js基础及布局


DOM操作
d3.select("h3")
.selectAll("p")
.text("hhh")
.style("color","red")
.attr("style","opacity:0.3")
.append()
.html()
.insert()
.remove()
功能和jQuery差不多
let dataset = ["hello","nihao","zzy"]
d3.select(".content").selectAll("p")
.data(dataset)
.text((d,i)=>{
    return d;   //内容和序号
})
let dataset = [1,2,3,4]
svg.selectAll("rect")
.data(dataset)
.enter()
.append("rect")
在d3中:有数据绑定的成为update,空元素绑定的为enter,没有数据绑定的成为exit
读取外部数据
d3.text
d3.json(url,(error,data)=>{

})
d3.html
d3.xml
d3.csv
d3.tev
绘制基本图形
颜色
RGB,HSL等
de.rgb(r,g,b)
.rgb("hsl(120,0.5,0.5)")
.rgb("#ffeeaa")
.rgb("red")
.brighter()
.darker()
.hsl()
.toString()
颜色插值
d3.interpolata()返回一个函数,输入[0,1]来得到两个颜色之间的插值
操作SVG
直线生成器
let data = [[30, 30], [330, 30],[330, 330], [630, 330]];
let canvas = d3.select('#s1');         //id为s1的SVG元素
//创建直线生成器
let lineGenerator = d3.svg.line()
.x(function(d) {       //获取每个节点的x坐标
    return d[0]
})
.y(function(d) {      //获取每个节点的y坐标
    return d[1];
});
canvas.append('path')        //在SVG上添加折线
    .attr('stroke', '#333')
    .attr('stroke-width', '2')
    .attr('fill', 'none')
    .attr('d', lineGenerator(data)); //设置路径信息
曲线生成器
lineGenerator.curve(d3.curveBasis)
区域生成器
let canvas = d3.select('#s1')         //id为s1的SVG元素
//创建区域生成器
let area = d3.area()
.x(function(d) { return d[0]; })
.y0(function(d) { return d[1]; })
.y1(function(d){ return d[1]*1.2 })    //默认为.y1(function(d) { return 0; })
.interpolate("basis");
let d = area([[100,20],[200,150],[300,70],[400,60]]);
canvas.append('path')        //在SVG上添加区域
    .attr('stroke', '#333')
    .attr('stroke-width', '2')
    .attr('fill', 'steelblue')
    .attr('d', d); //设置路径信息
弧生成器(饼状图)
let width = 400;
let height = 400;
let dataset = [ 30 , 10 , 43 , 55 , 13 ];

let svg = d3.select("body")
.append("svg")
.attr("width", width)
.attr("height", height);

let pie = d3.layout.pie();

let piedata = pie(dataset);

let outerRadius = 150;    //外半径
let innerRadius = 0;    //内半径,为0则中间没有空白

let arc = d3.svg.arc()    //弧生成器
.innerRadius(innerRadius)    //设置内半径
.outerRadius(outerRadius);    //设置外半径

let color = d3.scale.category10();

let arcs = svg.selectAll("g")
.data(piedata)
.enter()
.append("g")
.attr("transform","translate("+ (width/2) +","+ (width/2) +")");

arcs.append("path")
    .attr("fill",function(d,i){
    return color(i);
})
    .attr("d",function(d){
    return arc(d);
});

arcs.append("text")
    .attr("transform",function(d){
    return "translate(" + arc.centroid(d) + ")";
})
    .attr("text-anchor","middle")
    .text(function(d){
    return d.data;
});
弦生成器(连接两端弧)、对角线生成器(连接两个点,三次贝塞尔曲线)、符号生成器...
柱状图
let width = 600;
let height = 600;
let svg = d3.select("body").append("svg")
.attr("width",width)
.attr("height",height);
let dataset = [ 30 , 20 , 45 , 12 , 21 ];
svg.selectAll("rect")
    .data(dataset)
    .enter()
    .append("rect")
    .attr("x",10)
    .attr("y",function(d,i){
    return i * 30;
})
    .attr("width",function(d,i){
    return d * 10;
})
    .attr("height",28)
    .attr("fill","red");
折线图
let dataset = [
  {x: 1, y: 350}, {x: 2, y: 230}, {x: 3, y: 478},
  {x: 4, y: 550}, {x: 5, y: 180}, {x: 6, y: 98},
  {x: 7, y: 100}, {x: 8, y: 220}, {x: 9, y: 65},
  {x:10, y: 110}, {x: 11, y: 320}, {x: 12, y: 165}
];

// 添加折线
let line = d3.svg.line()
    .x(function(d) {
      return d.x*50;
    })
    .y(function(d) {
      return 600-d.y;
    })
    // 选择线条的类型
    .interpolate('linear');
// 添加path元素,并通过line()计算出值来赋值
svg.append('path')
      .attr('stroke', '#333')
      .attr('stroke-width', '2')
      .attr('d', line(dataset))
      .attr('fill','none');
svg.append('path')
      .attr('stroke', 'red')
      .attr('stroke-width', '4')
      .attr('d', 'M0,600L600,600');
svg.append('path')
      .attr('stroke', 'red')
      .attr('stroke-width', '4')
      .attr('d', 'M0,0L0,600');
比例尺
线性比例尺,超过domain按比例
d3.scale.linear().domain([1,5]).range([0,100])
序数比例尺,超过domain循环。
d3.scaleOrdinal().domain(['jack','kc']).range([10,20])
量化比例尺
d3.scaleQuesize().domain([0,10]).range(['small','medium','long'])
颜色比例尺
d3.scale.ordinal(de.schemeCategory10)
时间比例尺
d3.scaleTime().domain([new Date(2021,0,1,0),new Date(2021,0,1,2)]).range([0,100])
逆向映射
let scale = d3.scale.linear().domain([1,5]).range([0,100])
scale.invert(50);
坐标轴
- scale()定义比例尺
- orient()定义朝向,d3.axisBottom(scale)新版
- ticks()定义分割数
- tickValues()指定刻度值
let xaxios = d3.svg.axios().scale(linear).orient("bottom").ticks(5);
svg.append("g").call(xaxios);
动态过渡
transition()启动过渡效果
svg.append("circle")
.attr("fill","red")
.transition()
.attr("fill","blue")
duration(2000)过渡时间
ease()过渡方式"linear circle elastic bounce"
delay()延迟函数
d3布局应用
布局应用实质就是数据转化的过程
| 布局 | API |
| 力导向布局(force) | |
| 分区图(parition) | |
| 直方图(histogram) | |
| 饼状图(pie) | |
| 弦图(chord) | |
| 集群图(cluster) | |
| 树状图(tree) | |
| 堆栈图(stack) | |
| 矩形树图(treemap) | |
| 捆图(bundle) | |
| 打包图(pack) | |
| 层级图(hierarchy) |
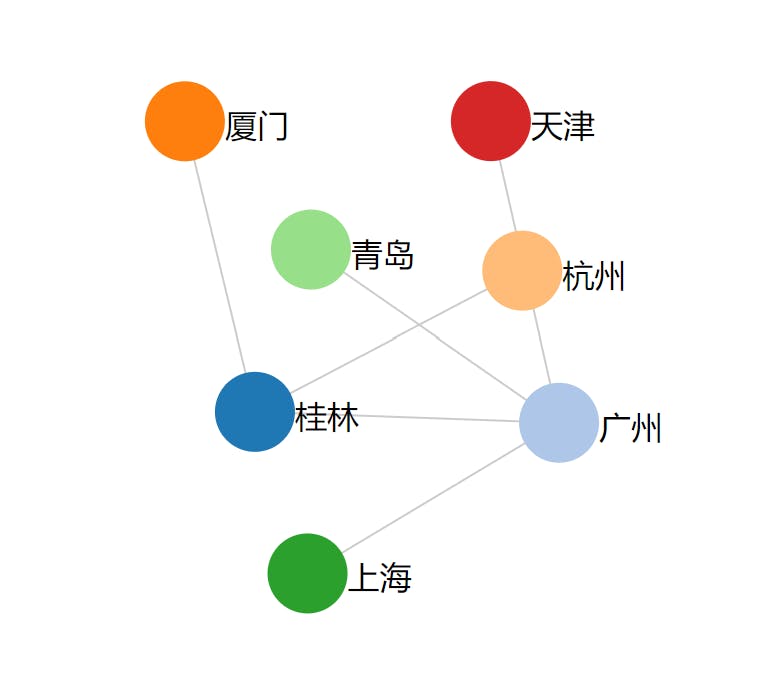
力导向图
- nodes()节点数组
- links()连线数组
- size()力导向图作用域范围
- linkDistance()连线之间的长度
- charge()设定弹力大小
- start()开始转化
- linkStrength()坚硬度
- friction()速度随时间产生的损耗
- chargeDistance()引力作用范围
- gravity()以size中心产生重力
- theta()限制计算时间
- alpha()动画冷却系数
let nodes = [ { name: "桂林"    }, { name: "广州" },
             { name: "厦门"    }, { name: "杭州"   },
             { name: "上海"   }, { name: "青岛"    },
             { name: "天津"    } ];
let edges = [  { source : 0  , target: 1 } , { source : 0  , target: 2 } ,
             { source : 0  , target: 3 } , { source : 1  , target: 4 } ,
             { source : 1  , target: 5 } , { source : 1  , target: 6 }  ];
let force = d3.layout.force()
                .nodes(nodes)        //指定节点数组
                .links(edges)        //指定连线数组
                .size([width,height])    //指定范围
                .linkDistance(150)    //指定连线长度
                .charge(-400);        //相互之间的作用力
let svg_edges = svg.selectAll("line")
                    .data(edges)
                    .enter()
                    .append("line")
                    .style("stroke","#ccc")
                    .style("stroke-width",1);
let color = d3.scale.category20();
//添加节点
let svg_nodes = svg.selectAll("circle")
                    .data(nodes)
                    .enter()
                    .append("circle")
                    .attr("r",20)
                    .style("fill",function(d,i){
                        return color(i);
                    })
                    .call(force.drag);    //使得节点能够拖动
力导向图事件
force.on()start、end、tick
force.on("tick", function(){    //对于每一个时间间隔
             //更新连线坐标
             svg_edges.attr("x1",function(d){ return d.source.x; })
                     .attr("y1",function(d){ return d.source.y; })
                     .attr("x2",function(d){ return d.target.x; })
                     .attr("y2",function(d){ return d.target.y; });
             //更新节点坐标
             svg_nodes.attr("cx",function(d){ return d.x; })
                     .attr("cy",function(d){ return d.y; });
             //更新文字坐标
             svg_texts.attr("x", function(d){ return d.x; })
                 .attr("y", function(d){ return d.y; });
        });
force.grag().on()dragstart、dragend、drag
let drag = force.drag()
.on("dragstart",function(d,i){
    d.fixed = true;    //拖拽开始后设定被拖拽对象为固定
    label_text_2.text("拖拽状态:开始");
})
.on("dragend",function(d,i){
    label_text_2.text("拖拽状态:结束");
})
.on("drag",function(d,i){
    label_text_2.text("拖拽状态:进行中");
});
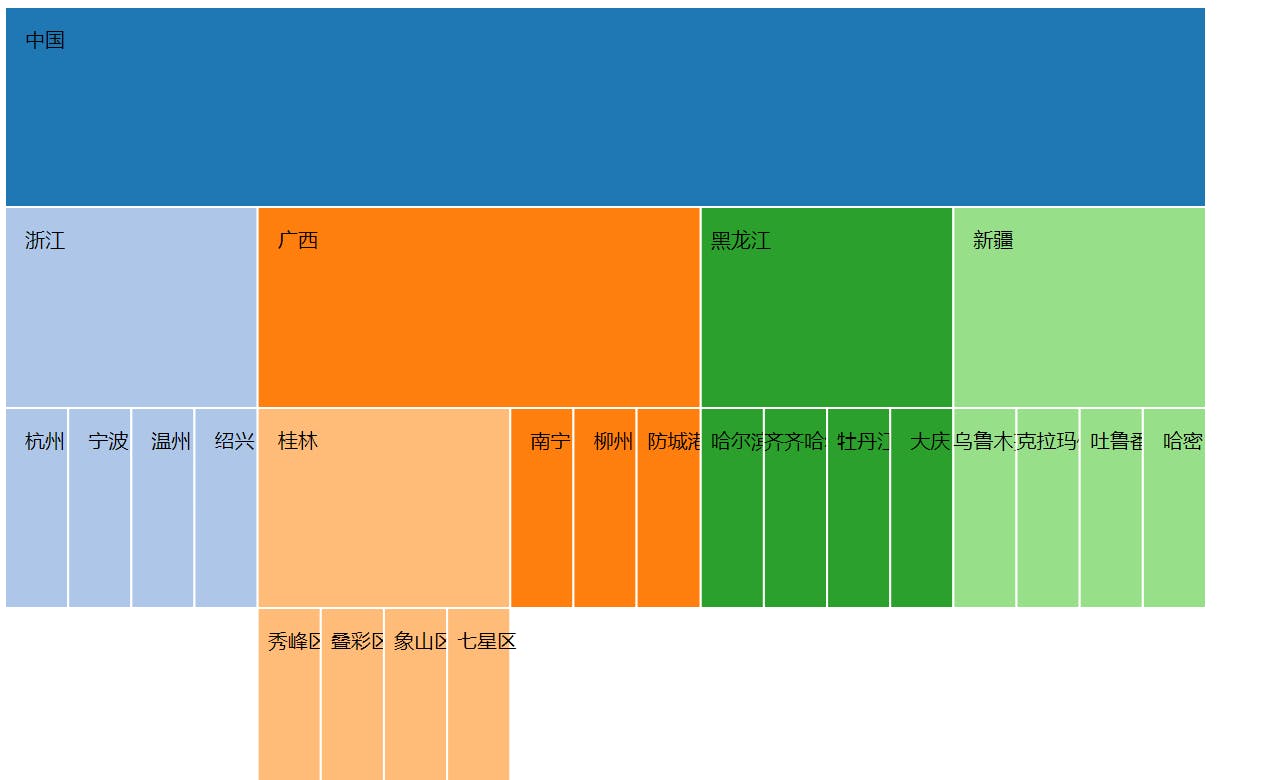
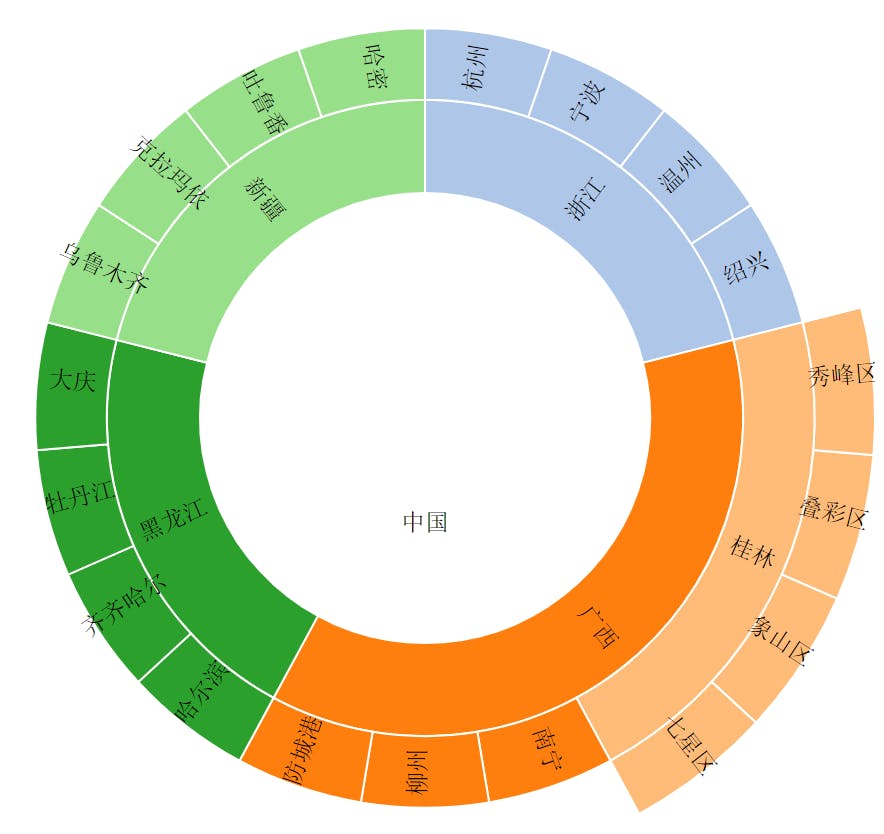
分区图
用于包含与被包含关系
- nodes()传入原始数据
- parent
- children
- value
- depth
- x,y,dx,dy
- links()传入nodes的数组
- children()默认d.children
- sort()同深度进行排序
- value()默认d.size
- size()设置区域
- rect: size([w,h])
- circle: size([2Math.PI,r\r])
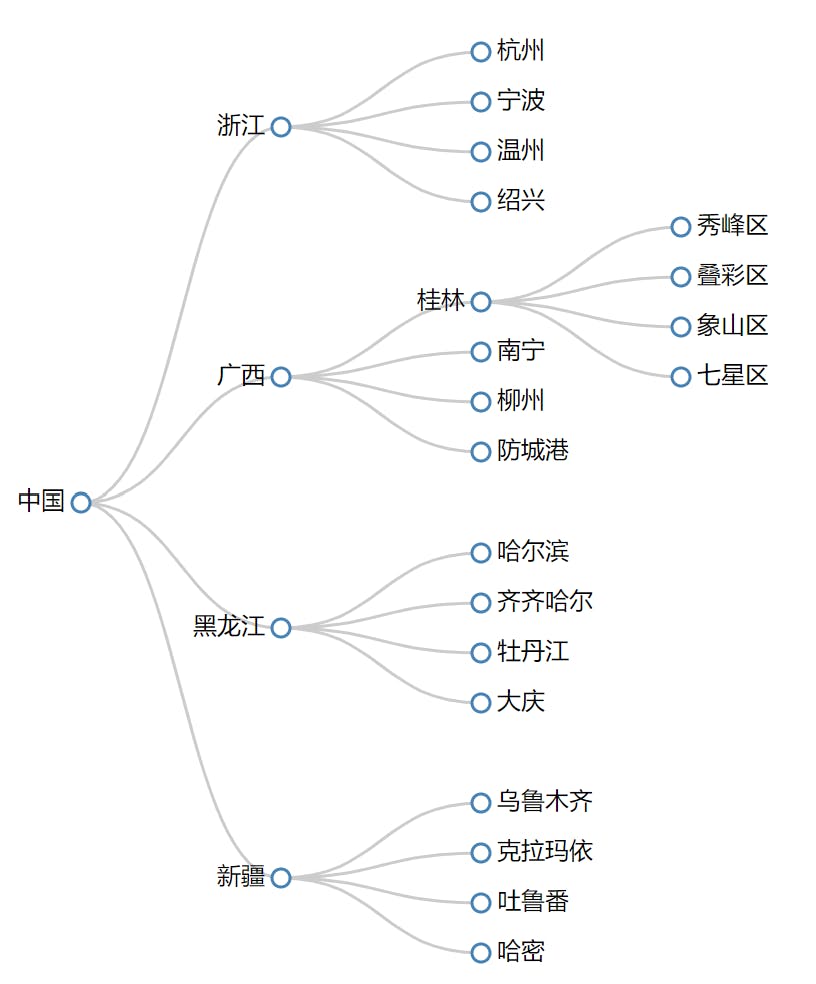
数据如下
{
"name":"中国",
"children":
[
    {
        "name":"广西" ,
        "children":
        [
            {
            "name":"桂林",
            "children":
            [
                {"name":"秀峰区"},
                {"name":"叠彩区"},
                {"name":"象山区"},
                {"name":"七星区"}
            ]
            },
            {"name":"南宁"},
            {"name":"柳州"},
            {"name":"防城港"}
        ]
    }
]
}
let nodes = partition.nodes(root);
let links = partition.links(nodes);
console.log(nodes);
let rects = svg.selectAll("g")
.data(nodes)
.enter().append("g");
//绘制矩形和文字
rects.append("rect")
    .attr("x", function (d) { return d.x; })    // 顶点的 x 坐标
    .attr("y", function (d) { return d.y; })    // 顶点的 y 坐标
    .attr("width", function (d) { return d.dx; })  // 顶点的宽度 dx
    .attr("height", function (d) { return d.dy; })  //顶点的高度 dy
    .style("stroke", "#fff")
    .style("fill", function (d) { return color((d.children ? d : d.parent).name); })
    .on("mouseover", function (d) {
    d3.select(this)
        .style("fill", "yellow");
})
    .on("mouseout", function (d) {
    d3.select(this)
        .transition()
        .duration(200)
        .style("fill", function (d) {
        return color((d.children ? d : d.parent).name);
    });
});
rects.append("text")
    .attr("class", "node_text")
    .attr("transform", function (d, i) {
    return "translate(" + (d.x + 20) + "," + (d.y + 20) + ")";
})
    .text(function (d, i) {
    return d.name;
});
直方图
类似柱形图
饼状图
见弧生成器
弦图
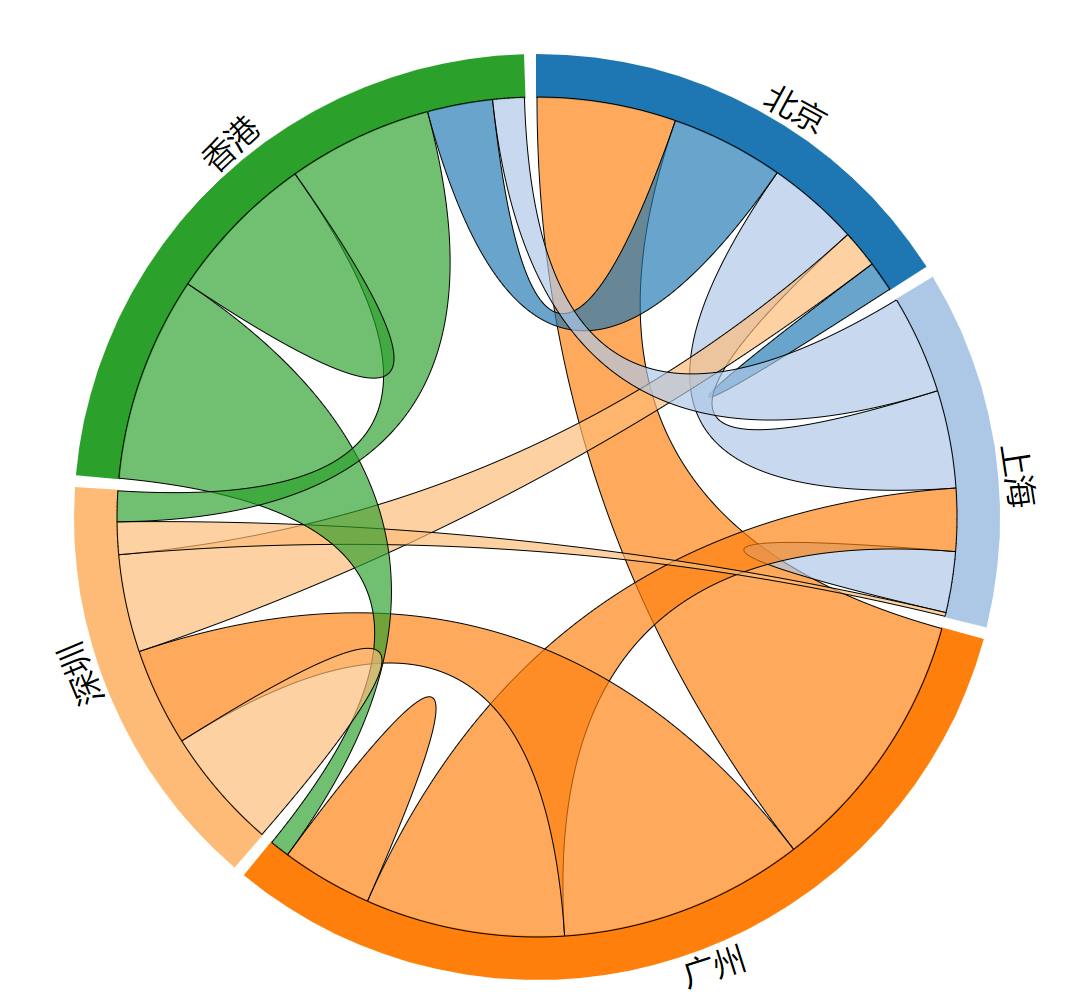
let city_name = [ "北京" , "上海" , "广州" , "深圳" , "香港"  ];
// 城市人口的来源,如
//                北京        上海
//    北京        1000        3045
//    上海        3214        2000
// 表示北京市的人口有1000个人来自本地,有3045人是来自上海的移民,总人口为 1000 + 3045
// 上海市的人口有2000个人来自本地,有3214人是来自北京的移民,总人口为 3214 + 2000
let population = [
    [ 1000,  3045  , 4567 , 1234 , 3714 ],
    [ 3214,  2000  , 2060 , 124  , 3234 ],
    [ 8761,  6545  , 3000 , 8045 , 647  ],
    [ 3211,  1067  , 3214 , 4000  , 1006 ],
    [ 2146,  1034  , 6745 , 4764  , 5000 ]
];

//2.转换数据,并输出转换后的数据
let chord_layout = d3.layout.chord()
.padding(0.03)
.sortSubgroups(d3.descending)
.matrix(population);

console.log(chord_layout.groups());
console.log(chord_layout.chords());

//3.SVG,弦图,颜色函数的定义
let width  = 600;
let height = 600;
let innerRadius = width/2 * 0.7;
let outerRadius = innerRadius * 1.1;

let color20 = d3.scale.category20();

let svg = d3.select("body").append("svg")
.attr("width", width)
.attr("height", height)
.append("g")
.attr("transform", "translate(" + width/2 + "," + height/2 + ")");

//4.绘制外部弦(即分组,有多少个城市画多少个弦),及绘制城市名称
let outer_arc =  d3.svg.arc()
.innerRadius(innerRadius)
.outerRadius(outerRadius);

let g_outer = svg.append("g");

g_outer.selectAll("path")
    .data(chord_layout.groups)
    .enter()
    .append("path")
    .style("fill", function(d) { return color20(d.index); })
    .style("stroke", function(d) { return color20(d.index); })
    .attr("d", outer_arc );

g_outer.selectAll("text")
    .data(chord_layout.groups)
    .enter()
    .append("text")
    .each( function(d,i) {
    d.angle = (d.startAngle + d.endAngle) / 2;
    d.name = city_name[i];
})
    .attr("dy",".35em")
    .attr("transform", function(d){
    return "rotate(" + ( d.angle * 180 / Math.PI ) + ")" +
        "translate(0,"+ -1.0*(outerRadius+10) +")" +
        ( ( d.angle > Math.PI*3/4 && d.angle < Math.PI*5/4 ) ? "rotate(180)" : "");
})
    .text(function(d){
    return d.name;
});


//5.绘制内部弦(即所有城市人口的来源,即有5*5=25条弧)
let inner_chord =  d3.svg.chord()
.radius(innerRadius);

svg.append("g")
    .attr("class", "chord")
    .selectAll("path")
    .data(chord_layout.chords)
    .enter()
    .append("path")
    .attr("d", inner_chord )
    .style("fill", function(d) { return color20(d.source.index); })
    .style("opacity", 1)
    .on("mouseover",function(d,i){
    d3.select(this)
        .style("fill","yellow");
})
    .on("mouseout",function(d,i) {
    d3.select(this)
        .transition()
        .duration(1000)
        .style("fill",color20(d.source.index));
});
集群图\树状图
.cluster() .tree()两者几乎一致,但集群图深度对应一致,树状图则不一致
let tree = d3.layout.tree()
    .size([width, height-200])
    .separation(function(a, b) { return (a.parent == b.parent ? 1 : 2); });

let diagonal = d3.svg.diagonal()
    .projection(function(d) { return [d.y, d.x]; });

let svg = d3.select("body").append("svg")
    .attr("width", width)
    .attr("height", height)
    .append("g")
    .attr("transform", "translate(40,0)");

d3.json("city_tree.json", function(error, root) {

    let nodes = tree.nodes(root);
    let links = tree.links(nodes);

    console.log(nodes);
    console.log(links);

    let link = svg.selectAll(".link")
      .data(links)
      .enter()
      .append("path")
      .attr("class", "link")
      .attr("d", diagonal);

    let node = svg.selectAll(".node")
      .data(nodes)
      .enter()
      .append("g")
      .attr("class", "node")
      .attr("transform", function(d) { return "translate(" + d.y + "," + d.x + ")"; })

    node.append("circle")
      .attr("r", 4.5);

    node.append("text")
      .attr("dx", function(d) { return d.children ? -8 : 8; })
      .attr("dy", 3)
      .style("text-anchor", function(d) { return d.children ? "end" : "start"; })
      .text(function(d) { return d.name; });
    });
堆栈图
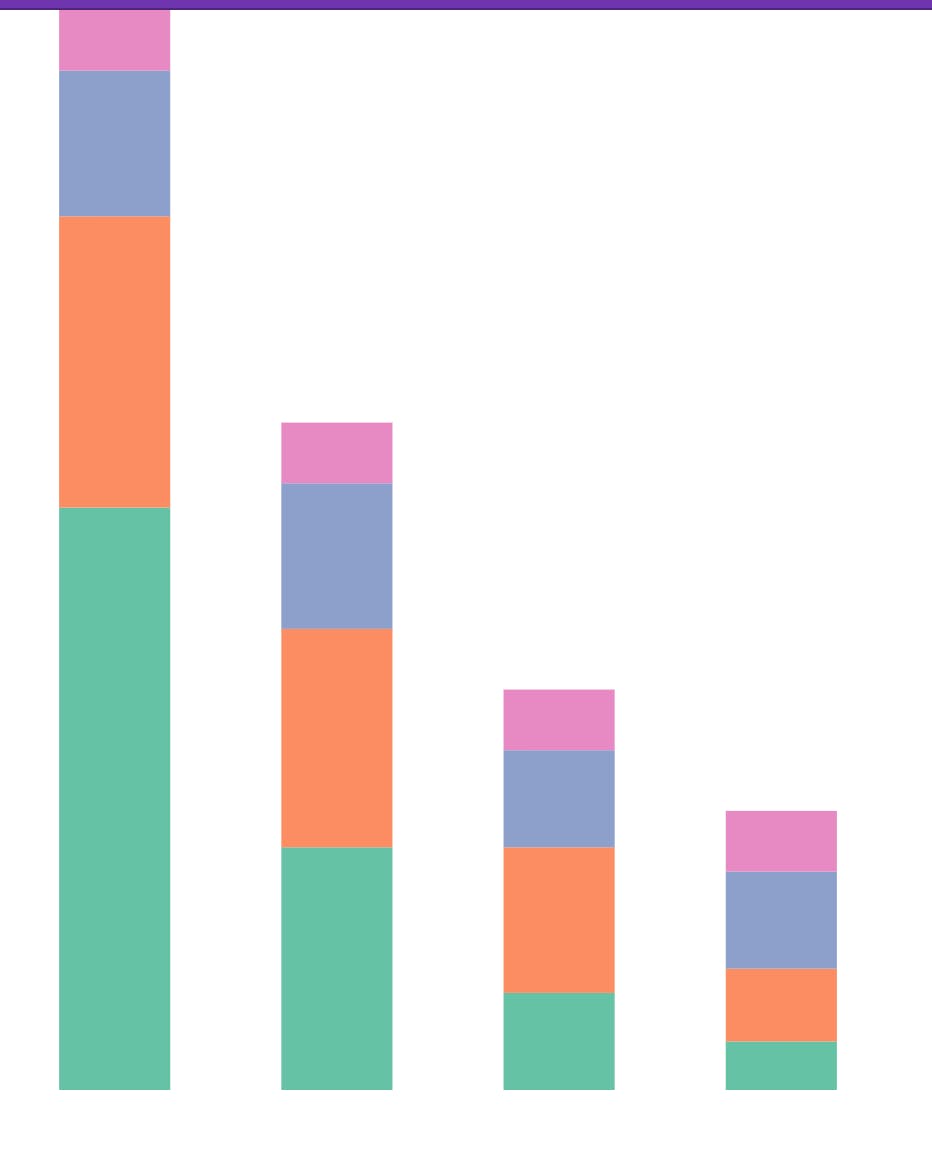
const dataset = [
    {month: new Date(2015, 0, 1), apples: 3840, bananas: 1920, cherries: 960, dates: 400},
    {month: new Date(2015, 1, 1), apples: 1600, bananas: 1440, cherries: 960, dates: 400},
    {month: new Date(2015, 2, 1), apples:  640, bananas:  960, cherries: 640, dates: 400},
    {month: new Date(2015, 3, 1), apples:  320, bananas:  480, cherries: 640, dates: 400}
  ];
let data = d3.stack().keys(["apples", "bananas", "cherries", "dates"]).order(d3.stackOrderNone)(dataset)

let padding = {left:50,right:100,top:30,bottom:30}
let xRangeWidth = width-padding.left-padding.right;
let yRangeHeight = height-padding.top-padding.bottom;

const xValue = d=>Moment(d.month).format('YYYY-M-D');

let xScale = d3.scaleBand()
.domain(dataset.map(d=>xValue(d)))
.range([0,xRangeWidth])
.padding(0.5);

let yScale = d3.scaleLinear()
.domain([0,d3.max(data,d=>d3.max(d,sub=>sub[1]))])
.range([yRangeHeight,0]);
// 坐标轴
let color = d3.scaleOrdinal().domain(["apples", "bananas", "cherries", "dates"]).range(d3.schemeSet2);
let g = d3.select("#s1").append("g")
g.selectAll("g").data(data).join("g")
.attr("fill",d=>color(d.key))
.selectAll('rect').data(d=>d).join('rect').attr("class",'datarect')
.attr('y',d=>yScale(d[1]))
.attr('x',d=>xScale(xValue(d.data)))
.attr('width',xScale.bandwidth())
.attr('height',d=>yScale(d[0])-yScale(d[1]))
PS:其他布局见官网,上面的写法参差不齐以官网为准